What Is the Shooting Star Pattern and How to Use It in Trading
Table of Contents
There are many different candlestick patterns in the crypto world that help traders to make successful deals. In this article, we'll explore a shooting star pattern: what it is, what it looks like, and how to use it in trading. Let’s begin!
What Is a Shooting Star Pattern?
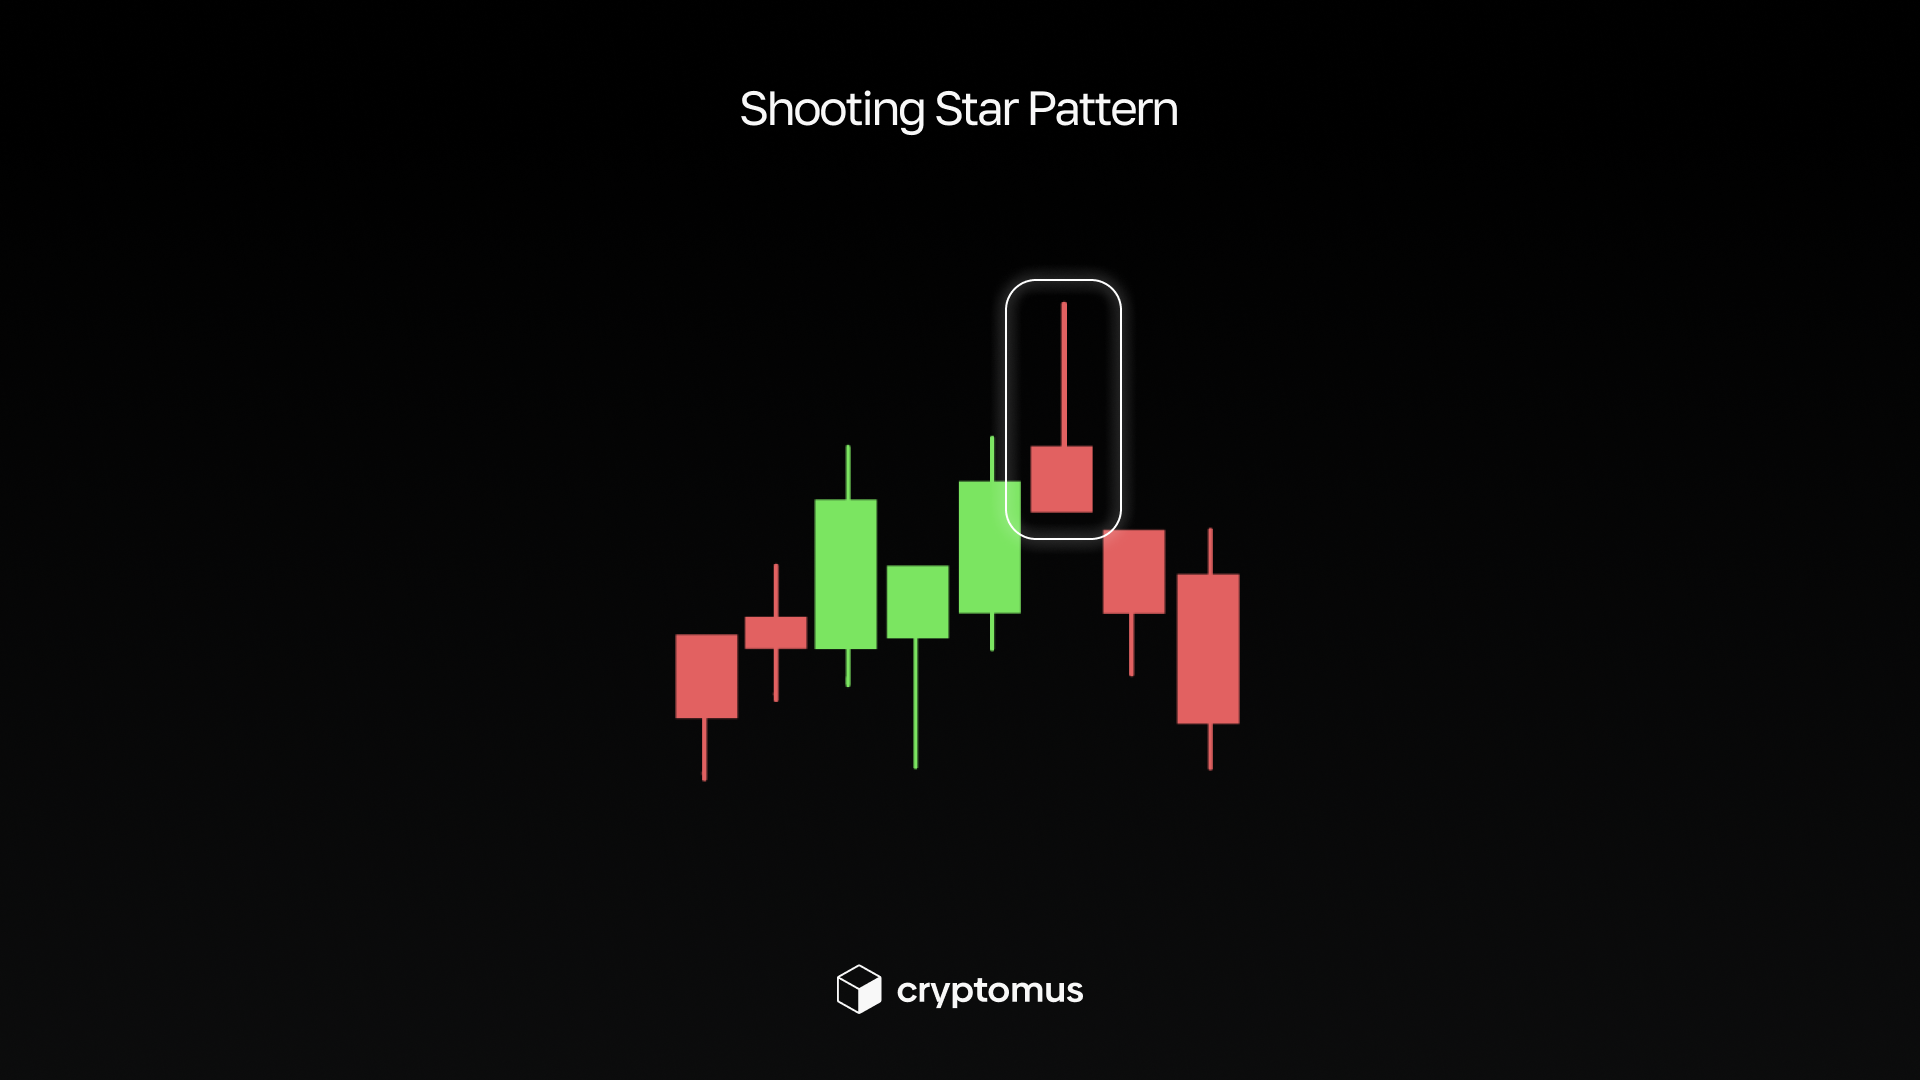
The shooting star pattern is a bearish reversal candlestick pattern that appears after an uptrend and indicates a weakening of bullish momentum. It warns of a possible downward reversal but requires confirmation by the next bearish candlestick or technical indicator signals.
Although a Shooting Star is a bearish pattern itself, its bullish version also exists. Let’s take a closer look at how they differ.
Bearish Shooting Star Pattern
The bearish version of a shooting star occurs when the candle closes below the opening, forming a red body. This shows that sellers not only repelled the growth but also managed to push the price below the initial level, which increases pressure from above. The red body makes the pattern more convincing because the balance of power is clearly shifted in favor of the bears. In such cases, traders are more likely to consider entering short positions if the next candle confirms the reversal.
Bullish Shooting Star Pattern
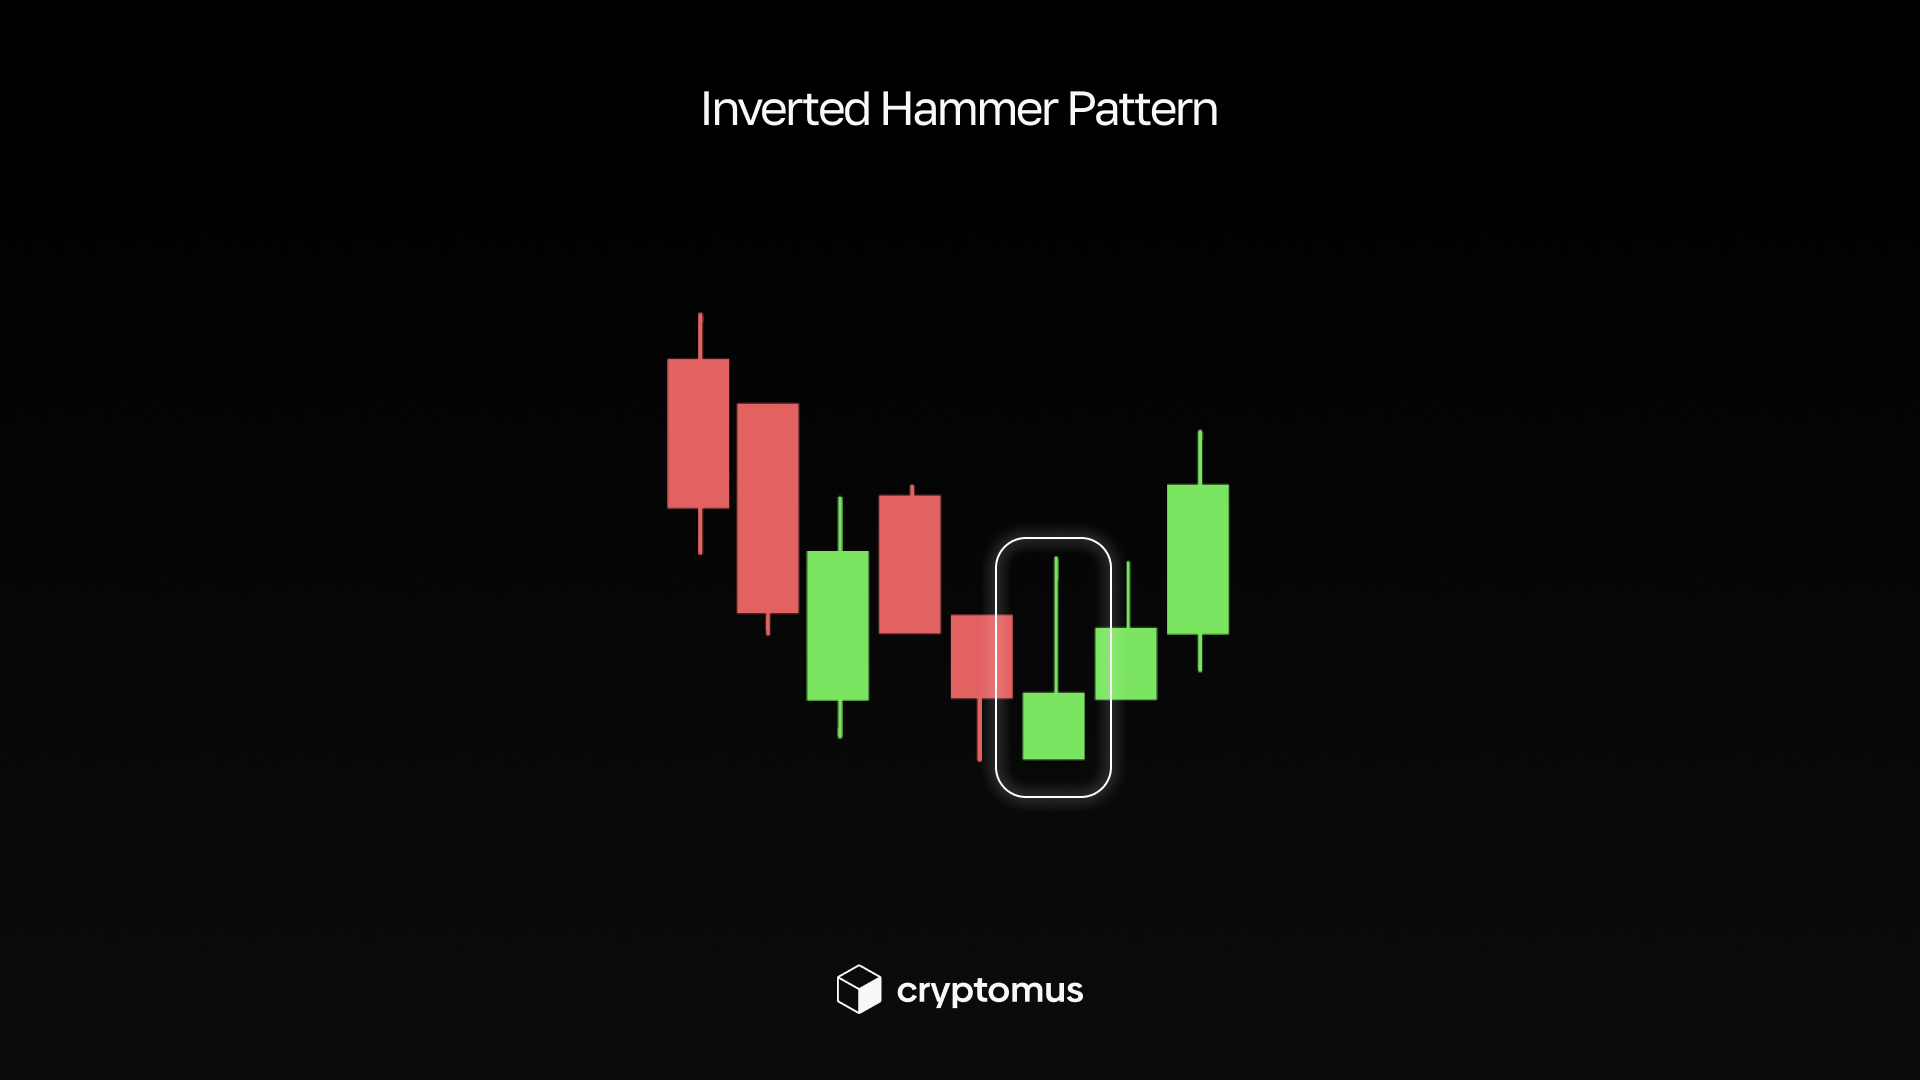
The bullish version of a shooting star is rare but possible when the candle closes above the opening price, i.e., the body is green. Such a candle is completely similar to a shooting star, but in terms of meaning, it’s closer to another pattern—an inverted hammer, which is formed after a downtrend and signals a possible rise. Here, buyers still managed to close the period slightly above the start, so although the pressure from sellers is noticeable due to the long upper shadow, it’s not dominant. This option is considered a weaker signal and requires strict confirmation—for example, a strong bearish candle the next day or a breakout of an important support level.
How to Identify a Shooting Star Pattern?
You can identify a shooting star pattern by several simple characteristics. First, make sure that there was a clear increase before the candlestick—without an upward trend, this pattern doesn’t make sense. Then look at the candlestick itself: it should have a small body at the bottom of the range, an almost absent lower shadow, and a long upper shadow, at least twice as long as the body, as shown on the picture below. This shape shows that the price rose significantly, but sellers sharply brought it back down to the opening. If the candle looks exactly like this and is at a local maximum, it’s a shooting star.
How to Use the Shooting Star Pattern in Trading?
The shooting star pattern is used in trading as an early signal of a possible downward reversal after an upward movement. When such a candlestick appears at a local maximum, traders begin to look for confirmation—for example, a strong bearish candlestick the next day, an increase in sales volumes, or a reversal of indicators such as RSI, MACD, or stochastics. If confirmation appears, you can consider entering a short position: aggressive traders enter when the falling star's low is broken, while more conservative traders enter after a confident close below it. Stop losses are usually placed above the high of the pattern's shadow.
This pattern is especially valuable for swing traders, as it helps identify reversal points within medium-term price swings, and for day traders who monitor local extremes where buyer momentum starts to weaken. The shooting star is also used for partial profit-taking on longs if it forms at a strong resistance level, as the pattern often warns of local pullbacks and a loss of upward momentum.

Pros and Cons of the Shooting Star Pattern
For your comfort we've created a table describing the most vital advantages and disadvantages of the Shooting Star Pattern.
| Pros | Cons | |
|---|---|---|
| Easy to recognize by its shape—small body and long upper shadow. | Requires additional confirmation, as the pattern alone is not reliable enough for high-confidence entries. | |
| Shows weakening buyers and an early change in momentum. | In a strong uptrend, the pattern can be completely ignored. | |
| Works in any market and many timeframes. | Reliability is lower in small timeframes due to noise. | |
| Provides a clear zone for stop loss (above the highs of the shadow). | Requires analysis of volumes, levels, and trends for accurate application. | |
| Helps to close longs or lock in profits in time. | Less effective on low-liquidity assets, where wicks are often exaggerated. |
Have you ever encountered a shooting star pattern? Did you use it? How did it go? Share your experience below!


Simplify Your Crypto Journey
Want to store, send, accept, stake, or trade cryptocurrencies? With Cryptomus it's all possible — sign up and manage your cryptocurrency funds with our handy tools.
Get Started